
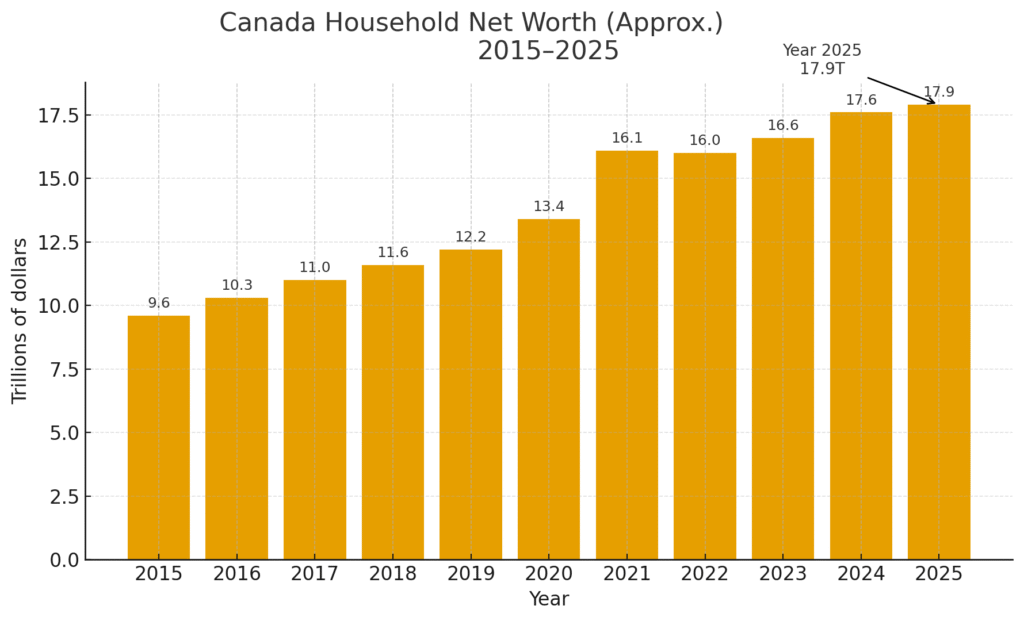
Statistics Canada’s most recent national balance sheet release says that Canadian households’ wealth rose again in the second quarter, reaching $17.9 trillion.
The 1.5% quarterly gain kept the uptrend going after a rough 2024, and it was driven by something we all know about.
As Canadian stocks stayed near record highs and portfolio values rose, financial assets did the heavy lifting.
The update gives a clearer picture of where the gains are coming from and what they mean for household finances at a time when borrowing costs are high and the housing market is looking worse.
Financial assets went up 2.7% to an all-time high of $11.2 trillion. Equities, investment funds, and pension benefits are all in that group, and they all do better when the markets go up.
More Read

The rise helped make up for the drop in nonfinancial assets, which fell to $17.3 trillion in the quarter.
Statistics Canada said that housing prices were a big reason for the drop, which was caused by a slower resale market and small price drops.
Residential real estate has only dropped 0.3% since the first quarter of 2024, but even small changes in such a large asset class can change the overall balance sheet.

The numbers hide big differences in the distribution of wealth. The agency said that the richest 20% of households own almost 70% of all financial assets.
That concentration means that when the market goes up, it usually favors households with more money because they own more stocks and investment funds.
The pattern is important for policymakers and lenders because it affects how increases in financial wealth are spent or paid off.
For investors, the skew helps explain why household net worth can go up even when people are more cautious about housing or job prospects.
Debt metrics show that the household sector is still getting used to higher rates. The debt service ratio went up a little to 14.41% in the quarter, but it is still below the 2023 high of 15.1%.
The debt-to-disposable-income ratio went up to 174.9%. That means that for every dollar of disposable income, Canadians had about 1.75 dollars in credit market debt. This is still less than the record level reached in late 2021.
More Read

These ratios don’t change very quickly, but they are very important for figuring out how sensitive households are to changes in interest rates and income.
Most borrowers seem to be able to handle renewals because things are stable near current levels. But this could change if income growth slows down.
The seasonally adjusted household saving rate dropped to 5% in the second quarter because spending grew by 1.2% while disposable income only grew by 0.3%.
When inflation goes down and people feel more comfortable using their cash savings, the saving rate usually goes down. However, this makes households more dependent on steady jobs and income.
The unemployment rate in Canada was 6.9% in June, the end of the quarter, and has been rising since then.
A long period of time near seven percent would put some households to the test, especially those who are about to renew their mortgages.
The nonfinancial side of the balance sheet is still affected by real estate. In some areas, prices have been under pressure as buyers get used to higher borrowing costs and limits on what they can afford.
Statistics Canada still called the recent drop small, though. If resale activity levels off and prices stop going down, nonfinancial assets could start to add value again or even slightly.
That would make it easier for financial markets to handle the gains in net worth. How households react to economic news depends on what their wealth is made up of.
When stocks and pension assets are driving up net worth, the effect on spending can take longer to show up than when housing prices are rising.
This is partly because stock holdings are more concentrated and retirement assets are harder to spend.
The distributional data backs that up. When the upper quintile gets most of the gains from financial assets, the overall wealth effect on retail sales can seem small even though the balance sheet looks better on paper.
The second quarter data for the housing market falls in a time of change. Listings have gotten better since the tightest times in the last few years, which is helping to ease price pressures in hot spots.
Costs and the availability of workers are still problems for new construction, even though some input prices have gone down. If borrowing costs start to go down in the next few quarters, things could change.
A slow rise in home values would help the nonfinancial asset side without bringing back the craziness that happened during the pandemic.
The national balance sheet shows that changes in the market take time to show up in people’s finances and don’t happen evenly.
Stronger equity benchmarks in the second quarter led to higher values for mutual funds and pensions.
This connection can protect families from bad times in the housing market, and it can also make swings bigger if the markets correct.
The best way for savers to lower that volatility is still to diversify their portfolios across different asset classes.
This year and next, the system will continue to get renewals from ultra-low pandemic mortgage rates. The data show that most households are able to make those higher payments, thanks to rising incomes and savings from the past.
If the job market gets worse, the stress would show up first in unsecured credit and then in mortgage arrears.
The second quarter update doesn’t show any signs of systemic strain, but the margin of safety is smaller than it was when savings rates were higher.
Two things will determine how wealthy households will be in the third quarter. Just like in the second quarter, the direction of the equity market will affect financial assets.
Real estate prices will decide if nonfinancial assets go from being a small drag to making a flat or positive contribution.
If both trends keep going up, the national balance sheet could see its eighth straight quarterly rise. If one of them falters, overall gains may slow down, but the current starting point is high by historical standards.
The report for the second quarter shows that the household sector is still dealing with the effects of higher rates, but the markets are getting stronger.
The total net worth, financial assets, and nonfinancial assets are all at their highest levels ever.
The way financial assets are spread out shows why the benefits are not evenly spread out. The big picture is one of resilience, but there are some familiar caveats about income growth, jobs, and the direction of borrowing costs.